mapp Vision V5.24
直方图是灰度值(亮度值)按其数量分布的简单表示。图像中每个可能灰度值(0 至 255)的相对或绝对像素数都会显示出来。
在 mapp Vision 人机界面的 "工具 "中,可通过左上角的按钮访问直方图。
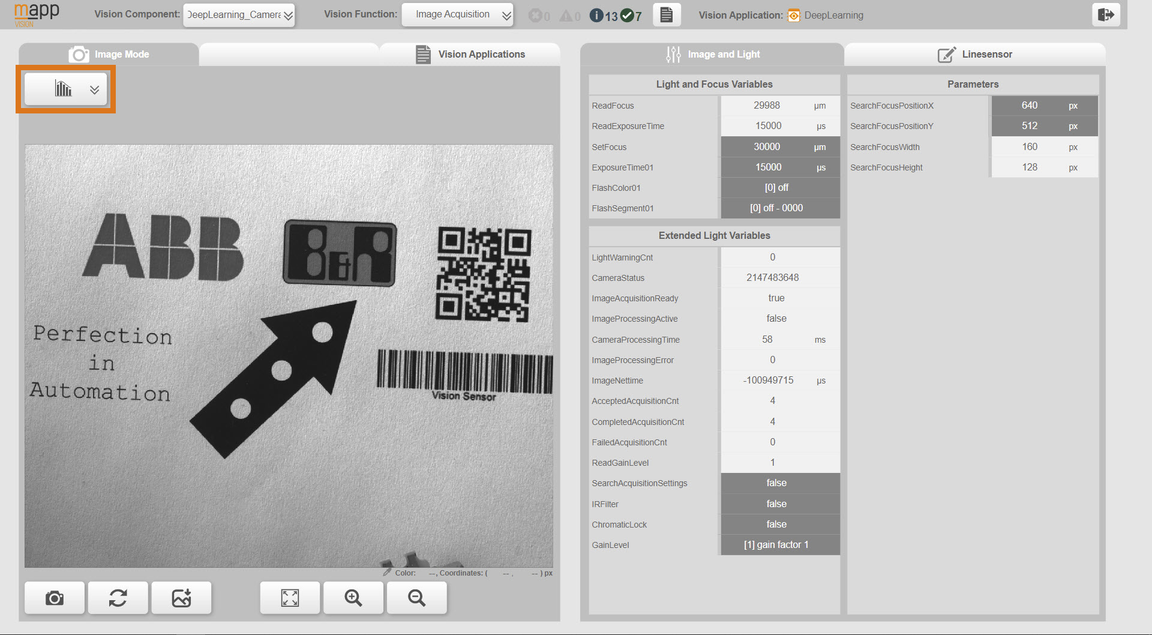
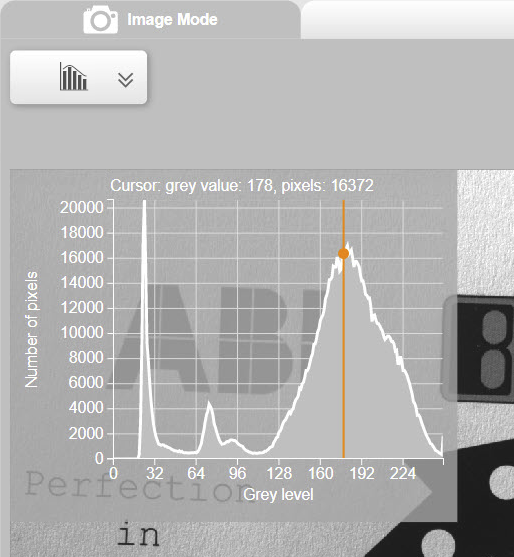
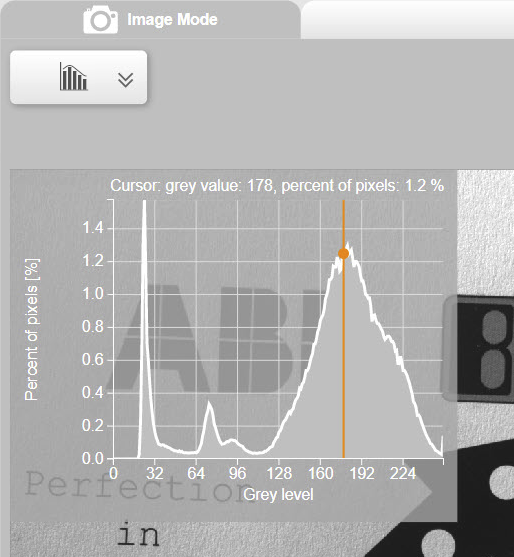
该按钮用于打开/关闭直方图叠加。叠加窗口使用图表显示灰度值分布。图表既可以显示像素的绝对数量,也可以显示像素占总数的百分比。
通过移动橙色线可选择所需的灰度值。根据选择的不同,会显示灰度值的相对或绝对频率。
使用案例
直方图可用于多种用途:
•输出整幅图像的直方图,以找到最佳曝光设置。这相当于一个特殊的视场(100% 缩放时的 FOV)。
•输出图像某一部分的直方图
•输出(执行)ROI 的直方图,以支持视觉功能教学。例如,确定像素计数器的灰度值。
mapp Vision V5.24
A histogram is a simple representation of the distribution of grayscale values (brightness values) according to their number. The relative or absolute number of pixels in the image is displayed for each possible gray value (0 to 255).
In the mapp Vision HMI, a histogram is accessible in the "Tools" via the button at the top left.
The button is for switching the histogram overlay on/off. The overlay window uses a chart to display the grayscale value distribution. The graph can display either the absolute number of pixels or as a percentage of the total number.
The desired gray value is selected by moving the orange line. Depending on the selection, the relative or absolute frequency of the gray value is displayed.
Use cases
The histogram can be used for a wide variety of use cases:
•Outputting the histogram of an entire image to find optimal exposure settings. This corresponds to a special field of view (FOV at 100% zoom).
•Outputting the histogram for a section of the image
•Outputting the histogram for an (Execution) ROI, as support for teaching a vision function. For example, determining the grayscale values for Pixel counter.